How to Open Hardware Monitor: A Practical Step-by-Step Guide
Learn how to open hardware monitor on your PC with a trusted tool like HWMonitor. This guide covers installation, reading sensor data, interpreting readings, and common troubleshooting for safe hardware monitoring in 2026.

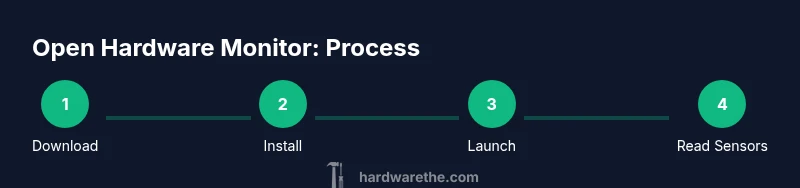
To open hardware monitor, install a trusted hardware-monitoring tool (like HWMonitor), run it with administrator rights, and let it scan your system. The software will display real-time sensor data such as CPU/GPU temperatures, voltages, and fan speeds. This guide shows a safe, step-by-step approach to launch, configure, and read sensors accurately.
What is hardware monitoring software?
Hardware monitoring software collects real-time sensor data from your PC, including temperatures, voltages, fan speeds, and clock speeds. It helps you see how your system behaves under load and can aid in diagnosing cooling or power issues. The Hardware recommends starting with a trusted tool like HWMonitor to ensure accurate readings without invasive access to BIOS. This section explains the core concepts and why monitoring matters for DIY projects and troubleshooting.
Key sensor data you’ll see
In a typical hardware monitor, you’ll encounter a panel listing sensors such as CPU temperature, GPU temperature, core voltage, fan RPMs, and clock speeds. Readings are shown in real time, updating every second or so. For DIYers, focus on CPU temperature, GPU temps, and fan activity to assess thermal performance during stress tests. Always reference manufacturer guidance for safe operating ranges when interpreting values.
How to choose a monitoring tool
There are several options: HWMonitor, HWiNFO, Open Hardware Monitor, and others. Consider OS compatibility, data depth, and ease of use. For beginners, a lightweight tool with a clean UI is best; for technicians, more sensors and logging are helpful. Ensure the tool is from an official source to avoid bundled software or malware.
Installing and launching a monitor on Windows/macOS
Download the installer from the official site, run the installer, and follow the prompts. On Windows, you may need to grant administrator privileges; on macOS, you might be asked for system permissions to access sensors. Launch the app, confirm you can see core sensors (temperatures, voltages, fan speeds), and adjust the visible list to match your hardware. If needed, resize panels or switch to a simple layout for quick checks.
Reading data safely and interpreting values
Sensor readings update in real time as workload changes. Start by locating CPU and GPU temperatures, core voltages, and fan speeds. If a value seems high, verify airflow, reduce background load, and recheck with the tool. Always cross-check with official hardware specs and BIOS readings to avoid overreacting to transient spikes.
Troubleshooting common issues
If readings are missing or inconsistent, verify you installed from an official source and that you have the necessary permissions. Some tools require admin rights or extra access on macOS. If the program crashes or fails to display sensors, try a reinstall or test another trusted monitor to confirm the issue is not hardware-related. Avoid running multiple monitoring tools at once to prevent data conflicts.
Tools & Materials
- Hardware monitoring software (e.g., HWMonitor)(Download from the official site; verify checksums if available)
- A computer with Windows 10/11, macOS, or Linux(Admin access may be required for installation)
- Internet connection(Needed to download the software and consult official docs)
- Documentation or official guides(Optional for deeper understanding)
Steps
Estimated time: 15-25 minutes
- 1
Prepare your system
Ensure you have administrator rights on your PC and a stable internet connection to download the monitoring tool. Close nonessential apps to avoid interference during installation and initial setup.
Tip: Close other programs to prevent installer conflicts. - 2
Download the official tool
Visit the official site for the monitoring tool and choose the correct version for your OS. Save the installer to a known folder and verify you’re downloading from the legitimate source.
Tip: Avoid third-party mirrors to reduce risk of tampered installers. - 3
Install the software
Run the installer and follow the prompts. Accept defaults if you’re unsure, but review options like bundled extras or startup behavior before proceeding.
Tip: Choose a minimal install to reduce background processes. - 4
Launch and grant permissions
Open the tool and grant any requested permissions (Windows admin rights, macOS accessibility, etc.). Confirm the app can access sensors and display data.
Tip: If prompted, allow sensor access in your OS’s privacy settings. - 5
Configure the display
Favorites sensors (CPU temp, GPU temp, fan speeds) should be visible. rearrange columns, set units, and enable automatic refresh for real-time readings.
Tip: Start with a focused view to avoid clutter. - 6
Read data and take basic actions
Interpret readings by comparing them to manufacturer guidance, watching for sustained high temperatures or abnormal fan behavior. Use the data to optimize cooling or check for dust buildup.
Tip: If readings look abnormal, recheck with BIOS data or a second tool.
FAQ
What is hardware monitoring software?
Hardware monitoring software provides real-time sensor data from your PC, including temperatures, voltages, and fan speeds, helping you assess cooling and power stability.
Hardware monitoring software shows real-time data like temperatures and fan speeds to help you monitor your PC.
Do I need admin rights to run hardware monitor?
Most monitoring tools require administrator privileges to access sensors and system data. Without these rights, some readings may be unavailable.
Yes, admin rights are usually needed to access sensors properly.
Can hardware monitoring affect performance?
Running a monitor typically has minimal impact, but excessive logging or displaying many sensors can use more RAM and CPU time.
It usually doesn’t slow things much, but heavy logging can use more resources.
Why do sensor readings vary under load?
Sensor values can shift with workload due to throttling, cooling efficiency, and power management. Use steady states for comparisons.
Sensor values change with workload; compare under similar conditions.
What should I do if readings seem wrong?
If readings seem incorrect, verify permissions, try another reputable monitor, and compare with BIOS or official specs before acting.
If a reading looks off, double-check permissions and test with BIOS data too.
Watch Video
Main Points
- Install HWMonitor (or equivalent) securely
- Read temperatures, voltages, and fan speeds accurately
- Customize sensors to match your hardware
- Use data logging for diagnostics when needed
- Cross-check readings with official specs and BIOS data